Rabu, 20 Mei 2009

Kemana Pergerakan Emas (21052009)

Kemana emas memilih jalannya..perhatikan analisis dibawah ini:


CLICK DI SINI UNTUK H4

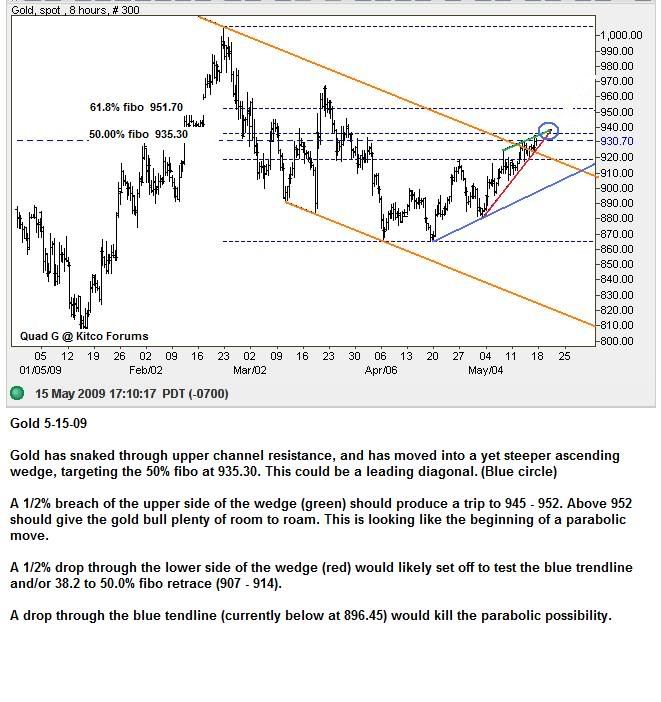
Emas memilih jalan untuk bullish kerana berjaya melepasi 930.
Emas kemungkinan akan bergerak sehingga ke 950 sebelum bergerak turun kembali untuk mengambil titik support agar membolehkan ia melantun kembali melepasi 950. Jadi..kene tegok resistance dan support pada ketika itu.
Penanda aras stoich, belum menunjukan 100% oversell, so trend masih lagi bullish.

Perhatikan graf di bawah ini untuk crude oil. Emas dan crude oil ni dah couple. pergerakan crude oil juga menunjukkan uptrend.


Kemana Pergerakkan emas (20052009)

Sila perhatikan pergerakan emas dengan di bawah:


Dari pergerakkan emas pada time frame h1, bagi short term emas akan menghadapi kenaikkan sehingga 928-930. Di sini pergerakkan emas mempunyai dua kebaragkalian, sekiranya emas dapat melepasi 930, maka pergerakan emas akan terus bullish selepas ini dan sekiranya pergerakan emas tidak melepasi 930, maka emas akan bergerak ke 911 >>>907, walau bagaimana pun perlu melepasi pivot line 920  dahulu. 

Secara conclusinya, for H1 bullish


walaubagaimana pun pergerakan untuk h4, telah menunjukkan bearish. walau bagaimana pun, perhatikan dahulu h1, sekiranya tidak dapat melepasi 930, maka confirm untuk H4 bearish.

antara titik penting:

Resistance 1 : 928 (kene lepas untuk membolehkan emas terus bullish, kalau x lepas sebaliknya terjadi.

Resistance 2: 939

Resistance 3: 946.

Pivot: 920 (kene confirm melepasi untuk membolehkan harga terus jatuh)

Support 1: 918

Support 2: 911

support 3: 907

 (monthly pivot: 894.97 melepasi paras ni ia akan jatuh lagi, tak lepas considered as bull trap)

however, titik penentuan ialah pada 930..sekiranya tidak melepasi 2-3 hari ni..maka harga akan jatuh kemungkinan ker 907. Ia juga bergantung kepada harga minyak dunia, kerana harga minyak dunia kini dah couple dengan harga emas.

Selasa, 19 Mei 2009

Kemana arah pergerakan emas (19052009)


Okay,setelah kita perhatikan pergerakan emas pada hari ini, didapati emas tidak dapat melepasi point 935 USD/oz dan kemungkinan besar ianya akan bergerak ke arah 914-907USD/oz.

Perhatikan realtime graph berikut pada time frame H4: 


Jika diperhatikan indicator stoich juga sudah mencapai over sell pada H4

Dan comparekan denagan timeframe D1:.kemana pergerakan emas dalam 3 hari ni?

I should also point out that if this Gold drop exceeds 906 and/or 3 days, then the deep v rally is in trouble.

Point2 yang perlu diperhatikan:

Support 1: 924.57 (dah lepas)
Support 2: 919.37 (dah lepas)
Support 3: 915.03

Pivot: 929.67

Resistance 1: 935.63 ( x lepas)
Resistance 2: 939.97
Resistance 3: 945.63

Sabtu, 16 Mei 2009

Gold: The Once and Future Money

Emas : Sebagai Wang Masa Lampau dan Wang Yang Akan Datang; demikian judul tulisan ini yang saya ambilkan dari judul buku yang ditulis oleh Nathan Lewis (John Wiley & Son, 2007) seorang senior economist pada sebuah perusahaan Asset Management di New York. Dia juga aktif dalam penulisan di media financial kenamaan seperti Financial Times dan the Wall Street Journal. Karena buku ini terbit tahun 2007 – jadi masih up to date sebagai ukuran buku ekonnomi.

Buku ini terdiri dari tiga bahagian utama, Bahagian Pertama membahas wang dalam berbagai bentuknya. Bahagian Kedua membahas sejarah wang Amerika Syarikat, dan Bahagian Ketiga membahas Krisis Mata Wang di Seluruh Dunia – termasuk diantaranya diulas krisis serius di Asia akhir tahun 90-an.

Yang menarik dari buku ini adalah bahwa meskipun yang penulis bukan seorang muslim, dalam hal wang dia memiliki pemikiran yang lurus. Dalam salah satu kesimpulan nya dia menulis seperti ini “ Mungkin perlu waktu beberapa tahun atau beberapa puluh tahun, tetapi era wang kertas perlahan lahan akan berakhir; Dunia tidak memiliki pilihan lain kecuali kembali ke hard currency. Manfaat dari hard currency sungguh luar biasa. System hard currency masa depan akan berdasarkan emas, sama keadaan dengan yang terjadi di masa lampau”.

Kalau Nathan Lewis mungkin belum terlalu terkenal, jadi pendapatnya biasa saja tidak dianggap oleh para pelaku ekonomi zaman ini; tetapi siapa yang tidak kenal John Naisbitt – yang di dunia barat dianggap kaya dan di anggap sebagai ‘dewa’  ekonomi modern karena prediksi dia tentang trend perekonomian dalam beberapa bukunya selama 20 tahun terakhir terbukti  ? Apa kata John Nasibitt tentang wang ini di bukunya terakhir (Mindset) ?. Menurut dia monopoly terakhir yang akan segera ditinggalkan oleh umat manusia adalah monopoly wang kertas yang dikeluarkan oleh suatu negara. masyarakat tidak akan lagi mempercayai mata wang kertas dan pindah ke yang dia sebut mata wang private. Apa itu mata wang private ? yaitu benda-benda real yang memang memiliki nilai intrinsik.

Sayang sekali Natha Lewis dan John Naisbitt bukan orang Islam, kalau dia tahu bahwa Islam memiliki system wang Dinar/Dirham- sejak ribuan tahun lalu sampai akhir zaman – pasti dia akan tahu betapa benarnya agama ini. Wallahu alam.

Ahad, 3 Mei 2009

Gold Bearish Trend Continues.

GOLD LONG TERM

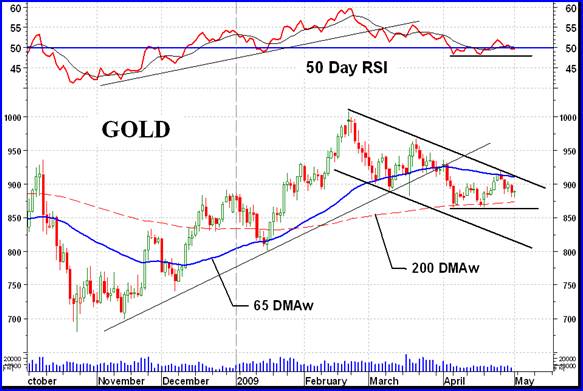
Interesting phenomena with the 200 day moving average line. The simple average line has turned downward even though the price of gold remains above the line. This is probably the result of the removal of the data 201 days ago and replaced by the data today, with both events given equal weight towards the calculation of the moving average. Using the weighted moving average line the more recent data is given greater weight towards the calculation of the moving average and the line slope remains positive.

Since issuing a bear signal the long term point and figure (P&F) chart has set up a support at the $870 level. $855 would be a new bear low for this latest trend. However, the chart has also set up a pattern that could cause the P&F to reverse itself and go back into a long term bull mode. At this time that would require a move to the $930 level and give us an initial projection to $1050. For now we’ll just have to wait and see which way the wind is blowing and which direction the price will take. For now the bear projection remains to the $705 level.

As for what the normal indicators are telling us, well they are not yet bearish as is the P&F chart. The gold price remains above its positive sloping (weighted) moving average line although it is heading towards the line. The momentum indicator remains just above its neutral line in the positive zone but just below its negative trigger line. The volume indicator is showing more weakness and remains below its negative sloping trigger line. As far as the normal trend and strength indicators are concerned the long term rating remains BULLISH for now.

INTERMEDIATE TERM


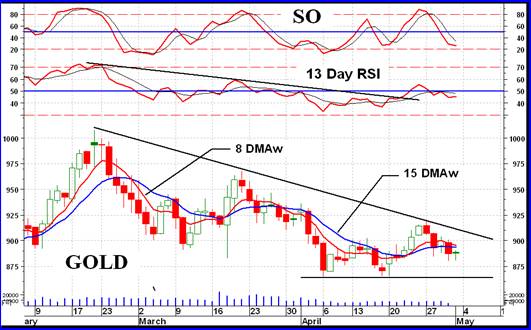
Very often trend and support/resistance lines in momentum indicators are more accurate or provide earlier signals than they do in the price charts. An example is seen in the chart here. The up trend line in the momentum indicator was broken a month before the gold price up trend line. Not drawn but a down trend line on the momentum indicator has already been broken. Are we in for an upside break in the price?

The gold price continues to show weakness and especially when combined with the very low volume activity. Although a clear support is shown in the price (and momentum) one starts to wonder about its viability. Questions, questions!


Going through the routine we see that the recent price action continued below the intermediate term moving average line and the line slope continues downward. The momentum indicator is playing around with its neutral line and closed the week just below the line in its negative zone. It is also just a shade below its negative trigger line. For now the action remains inside that intermediate term down trending channel. What can I say but that the intermediate term rating is BEARISH, at this time. With the price action trapped between both moving average lines one has to give.

SHORT TERM

Short term it looks like we are going through a little period of negative trend. It might still go a little lower but here’s hoping it stops above the support. With the price below its negative moving average line and the momentum indicator in its negative zone about the only non-confirmation we have of a negative trend is the very short term moving average line. It has not yet crossed the short term line on the down side but is closing the gap fast. The short term must be thought of as BEARISH at this time.

As for the direction of least resistance, that would be to the down side although there is some indication during Friday’s action that it might turn around.