Selasa, 19 Mei 2009

Kemana arah pergerakan emas (19052009)


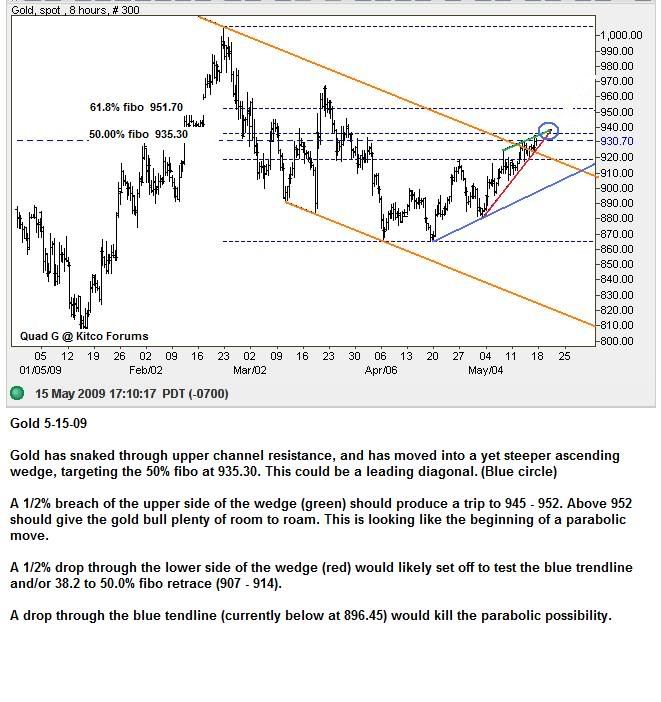
Okay,setelah kita perhatikan pergerakan emas pada hari ini, didapati emas tidak dapat melepasi point 935 USD/oz dan kemungkinan besar ianya akan bergerak ke arah 914-907USD/oz.

Perhatikan realtime graph berikut pada time frame H4: 


Jika diperhatikan indicator stoich juga sudah mencapai over sell pada H4

Dan comparekan denagan timeframe D1:.kemana pergerakan emas dalam 3 hari ni?

I should also point out that if this Gold drop exceeds 906 and/or 3 days, then the deep v rally is in trouble.

Point2 yang perlu diperhatikan:

Support 1: 924.57 (dah lepas)
Support 2: 919.37 (dah lepas)
Support 3: 915.03

Pivot: 929.67

Resistance 1: 935.63 ( x lepas)
Resistance 2: 939.97
Resistance 3: 945.63

Sabtu, 16 Mei 2009

Gold: The Once and Future Money

Emas : Sebagai Wang Masa Lampau dan Wang Yang Akan Datang; demikian judul tulisan ini yang saya ambilkan dari judul buku yang ditulis oleh Nathan Lewis (John Wiley & Son, 2007) seorang senior economist pada sebuah perusahaan Asset Management di New York. Dia juga aktif dalam penulisan di media financial kenamaan seperti Financial Times dan the Wall Street Journal. Karena buku ini terbit tahun 2007 – jadi masih up to date sebagai ukuran buku ekonnomi.

Buku ini terdiri dari tiga bahagian utama, Bahagian Pertama membahas wang dalam berbagai bentuknya. Bahagian Kedua membahas sejarah wang Amerika Syarikat, dan Bahagian Ketiga membahas Krisis Mata Wang di Seluruh Dunia – termasuk diantaranya diulas krisis serius di Asia akhir tahun 90-an.

Yang menarik dari buku ini adalah bahwa meskipun yang penulis bukan seorang muslim, dalam hal wang dia memiliki pemikiran yang lurus. Dalam salah satu kesimpulan nya dia menulis seperti ini “ Mungkin perlu waktu beberapa tahun atau beberapa puluh tahun, tetapi era wang kertas perlahan lahan akan berakhir; Dunia tidak memiliki pilihan lain kecuali kembali ke hard currency. Manfaat dari hard currency sungguh luar biasa. System hard currency masa depan akan berdasarkan emas, sama keadaan dengan yang terjadi di masa lampau”.

Kalau Nathan Lewis mungkin belum terlalu terkenal, jadi pendapatnya biasa saja tidak dianggap oleh para pelaku ekonomi zaman ini; tetapi siapa yang tidak kenal John Naisbitt – yang di dunia barat dianggap kaya dan di anggap sebagai ‘dewa’  ekonomi modern karena prediksi dia tentang trend perekonomian dalam beberapa bukunya selama 20 tahun terakhir terbukti  ? Apa kata John Nasibitt tentang wang ini di bukunya terakhir (Mindset) ?. Menurut dia monopoly terakhir yang akan segera ditinggalkan oleh umat manusia adalah monopoly wang kertas yang dikeluarkan oleh suatu negara. masyarakat tidak akan lagi mempercayai mata wang kertas dan pindah ke yang dia sebut mata wang private. Apa itu mata wang private ? yaitu benda-benda real yang memang memiliki nilai intrinsik.

Sayang sekali Natha Lewis dan John Naisbitt bukan orang Islam, kalau dia tahu bahwa Islam memiliki system wang Dinar/Dirham- sejak ribuan tahun lalu sampai akhir zaman – pasti dia akan tahu betapa benarnya agama ini. Wallahu alam.

Ahad, 3 Mei 2009

Gold Bearish Trend Continues.

GOLD LONG TERM

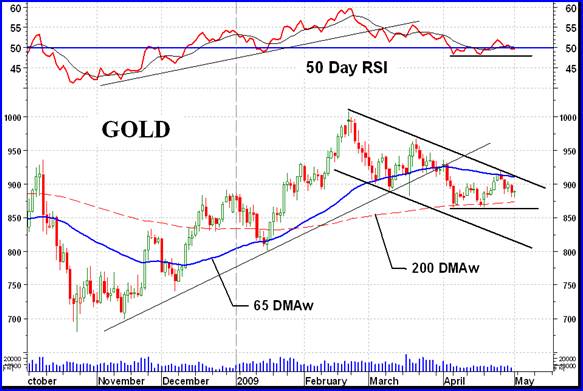
Interesting phenomena with the 200 day moving average line. The simple average line has turned downward even though the price of gold remains above the line. This is probably the result of the removal of the data 201 days ago and replaced by the data today, with both events given equal weight towards the calculation of the moving average. Using the weighted moving average line the more recent data is given greater weight towards the calculation of the moving average and the line slope remains positive.

Since issuing a bear signal the long term point and figure (P&F) chart has set up a support at the $870 level. $855 would be a new bear low for this latest trend. However, the chart has also set up a pattern that could cause the P&F to reverse itself and go back into a long term bull mode. At this time that would require a move to the $930 level and give us an initial projection to $1050. For now we’ll just have to wait and see which way the wind is blowing and which direction the price will take. For now the bear projection remains to the $705 level.

As for what the normal indicators are telling us, well they are not yet bearish as is the P&F chart. The gold price remains above its positive sloping (weighted) moving average line although it is heading towards the line. The momentum indicator remains just above its neutral line in the positive zone but just below its negative trigger line. The volume indicator is showing more weakness and remains below its negative sloping trigger line. As far as the normal trend and strength indicators are concerned the long term rating remains BULLISH for now.

INTERMEDIATE TERM


Very often trend and support/resistance lines in momentum indicators are more accurate or provide earlier signals than they do in the price charts. An example is seen in the chart here. The up trend line in the momentum indicator was broken a month before the gold price up trend line. Not drawn but a down trend line on the momentum indicator has already been broken. Are we in for an upside break in the price?

The gold price continues to show weakness and especially when combined with the very low volume activity. Although a clear support is shown in the price (and momentum) one starts to wonder about its viability. Questions, questions!


Going through the routine we see that the recent price action continued below the intermediate term moving average line and the line slope continues downward. The momentum indicator is playing around with its neutral line and closed the week just below the line in its negative zone. It is also just a shade below its negative trigger line. For now the action remains inside that intermediate term down trending channel. What can I say but that the intermediate term rating is BEARISH, at this time. With the price action trapped between both moving average lines one has to give.

SHORT TERM

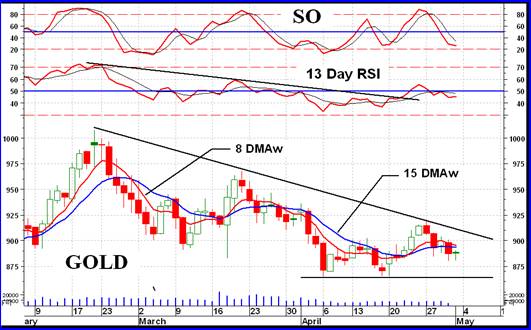
Short term it looks like we are going through a little period of negative trend. It might still go a little lower but here’s hoping it stops above the support. With the price below its negative moving average line and the momentum indicator in its negative zone about the only non-confirmation we have of a negative trend is the very short term moving average line. It has not yet crossed the short term line on the down side but is closing the gap fast. The short term must be thought of as BEARISH at this time.

As for the direction of least resistance, that would be to the down side although there is some indication during Friday’s action that it might turn around.

Selasa, 28 April 2009

Bagaimana wang dicipta ?

Wang diwujudkan melalui dua cara :

1. Wang diwujudkan melalui pinjaman dan membelanjakannya.Fractional Reserve Banking. (Money is literally borrowed and spent into existence.)

2. Wang dicetak atas kertas kosong tanpa sandaran apa - apa oleh Federal Reserve.
Federal Reserve memiliki kuasa :

a) Menentukan kadar faedah.
b) Membeli aset – aset seperti hutang kerajaan (government debt) dengan wang kertas baru yang dicetak.

Apabila kadar faedah berada dalam tahap yang sangat rendah , ia akan mengalakkan korporat dan individu berbelanja.
Majoriti wang yang diwujudkan datang dari pinjaman dan perbelanjaan sektor swasta dan individu.
Wang tunai ( cash flow) 5 % , Wang elektronik ( cek, akaun dll ) 95 %.

Federal Reserve boleh mencipta wang baru hanya dengan menekan nombor pada keyboard komputer dan membeli apa sahaja aset yang mereka perlukan. Mereka boleh mencipta berapa pun jumlah wang yang diperlukan untuk menjalankan ekonomi bagi menyelesaikan hutang lama dan baru. Mereka akan mencetak wang baru kerana bagi mereka inflasi esok hari adalah lebih baik dari keruntuhan terus sistem ekonomi sekarang.

Perbendaharaan US (U.S. Treasury) berbelanja dengan US $450 Billion defisit ( belanja lebih dari aset ). Bank Pusat hanya mencetak wang itu. Secara global bank bank pusat mencetak wang baru berjumlah $800 Billion. Sebab itu Federal Reserve Governor, Ben S. Bernanke, suka menamakannya dengan wang helikopter "Helicopter Money".

40 % dari hutang perbedaharaan US (U.S. Treasury debt) dipegang oleh orang luar. Bank bank Pusat Asia memegang lebih dari US$ 1 Trillion aset US.
Apabila lebih banyak wang yang dicipta ini mengejar barangan yang sama, tidak dapat tidak mestilah berlaku inflasi.

Jumlah defisit yang besar memberi jalan kepada Bank Pusat luar mencetak wang mereka. Syarikat luar mendapatkan dollar melalui ekspot barangan mereka ke US. Bank Pusat luar mengeluarkan mata wang mereka untuk ditukarkan dengan dollar, dan dengan dollar tersebut mereka membeli hutang Perbendaharaan US (U.S. treasury debt). Mudah sahaja, wang baru pulak dicipta di negara tersebut.

Contohnya China, Bank Pusat China mencetak wang baru untuk membeli dollar. Dollar didapati dari ekspot China ke US, dollar datang dari US Treasury. Ini menyebabkan berlakunya inflasi 5% setahun di China.

Apabila US berbelanja defisit , dollar baru akan tercipta. Setiap kali dollar baru bertukar tangan ke Negara asing. Bank Pusat Negara tersebut pulak mencipta wang baru untuk ditukar dengan dollar.

Semua Negara bergantung kepada perbelajaan US.
Apabila rakyak US tidak berbelanja, seluruh dunia tidak bergerak.

Begitu besarnya pergantungan seluruh dunia kepada Amerika Syarikat !

• Sumber:www.dirham2dinar.com
Selasa, 21 April 2009

Gold Market Update

Both gold and silver have suffered technical deterioration over the past week with the result that they are now close to aborting the short to medium-term bullish scenario that was set out in the last update. Meanwhile, large Precious Metals shares are on the point of breaking down from their shallow uptrends in force from December - January after further losses this past week.

As we can see on its 6-month gold has not broken down below key support - yet, and it may even be at a buy spot right now, however, there are two external factors suggesting that the risk of it breaking down has increased significantly. One is that silver has broken below its mid-March hammer low, which is a bearish development, and the other is that the dollar looks like it may be completing a minor base area.

Returning to consideration of the gold chart we can see that last week's fall has not as yet resulted in it breaking below its early April low or below the 200-day moving average or below the support level shown. This confluence of supporting factors means that this is a very important zone, so if gold breaks below it, it could plunge way below the support of the downtrend channel shown. Traders may therefore want to set stops accordingly.