Pergerakan emas akan mengalami sedikit correction untuk uptrend..But still major in bearish condition. This uptrend can be up to 950Usd/oz and later rebounce back to 930 ..903 is still valid if and only if the price does not break 950USD/oz
H4 Graph
Gold had dropped below level 940 (below the neckline), stating that “head and shoulders” trend-turning figure had been executed. Now the market has its target set to level 903, which is supposed to be reached in nearest future. Besides, gold is being traded below the lower bound of daily uptrend, what confirms this scenario is likely to take place.

Daily Graph
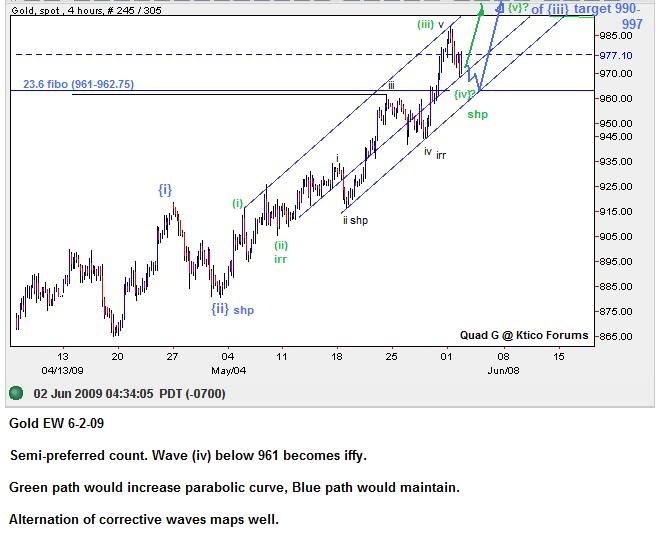
Having stopped slightly below the strategic resistance level 998 (“Z” trend line), gold eventually formed up a “double top” trend-turning figure at H4 graph (denoted as “a-a+” trend) and executed it after getting under the level 967. Such an event is a very important signal for “B-B+” daily trend’s turn. I’m expecting its lower bound to be broken shortly and, if gold goes under the level 945 (under the “B” trend line), the uptrend will be changed to downtrend and gold will set the target of lowering to support level 903.

Monthly Graph