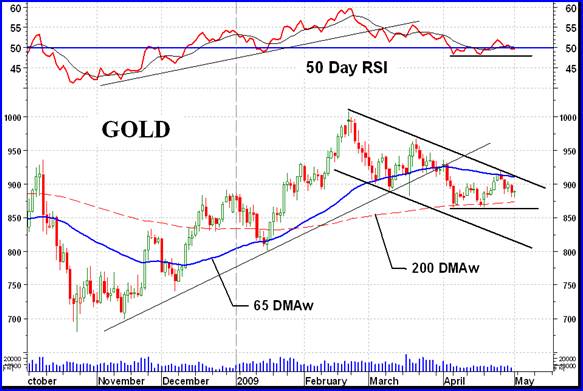
GOLD LONG TERM
Interesting phenomena with the 200 day moving average line. The simple average line has turned downward even though the price of gold remains above the line. This is probably the result of the removal of the data 201 days ago and replaced by the data today, with both events given equal weight towards the calculation of the moving average. Using the weighted moving average line the more recent data is given greater weight towards the calculation of the moving average and the line slope remains positive.
Since issuing a bear signal the long term point and figure (P&F) chart has set up a support at the $870 level. $855 would be a new bear low for this latest trend. However, the chart has also set up a pattern that could cause the P&F to reverse itself and go back into a long term bull mode. At this time that would require a move to the $930 level and give us an initial projection to $1050. For now we’ll just have to wait and see which way the wind is blowing and which direction the price will take. For now the bear projection remains to the $705 level.
As for what the normal indicators are telling us, well they are not yet bearish as is the P&F chart. The gold price remains above its positive sloping (weighted) moving average line although it is heading towards the line. The momentum indicator remains just above its neutral line in the positive zone but just below its negative trigger line. The volume indicator is showing more weakness and remains below its negative sloping trigger line. As far as the normal trend and strength indicators are concerned the long term rating remains BULLISH for now.
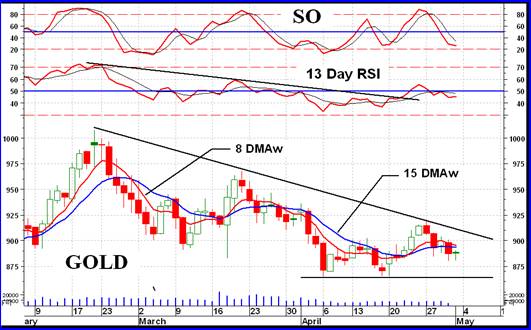
INTERMEDIATE TERM
Very often trend and support/resistance lines in momentum indicators are more accurate or provide earlier signals than they do in the price charts. An example is seen in the chart here. The up trend line in the momentum indicator was broken a month before the gold price up trend line. Not drawn but a down trend line on the momentum indicator has already been broken. Are we in for an upside break in the price?
The gold price continues to show weakness and especially when combined with the very low volume activity. Although a clear support is shown in the price (and momentum) one starts to wonder about its viability. Questions, questions!
The gold price continues to show weakness and especially when combined with the very low volume activity. Although a clear support is shown in the price (and momentum) one starts to wonder about its viability. Questions, questions!
Going through the routine we see that the recent price action continued below the intermediate term moving average line and the line slope continues downward. The momentum indicator is playing around with its neutral line and closed the week just below the line in its negative zone. It is also just a shade below its negative trigger line. For now the action remains inside that intermediate term down trending channel. What can I say but that the intermediate term rating is BEARISH, at this time. With the price action trapped between both moving average lines one has to give.
SHORT TERM
Short term it looks like we are going through a little period of negative trend. It might still go a little lower but here’s hoping it stops above the support. With the price below its negative moving average line and the momentum indicator in its negative zone about the only non-confirmation we have of a negative trend is the very short term moving average line. It has not yet crossed the short term line on the down side but is closing the gap fast. The short term must be thought of as BEARISH at this time.
As for the direction of least resistance, that would be to the down side although there is some indication during Friday’s action that it might turn around.
Tiada ulasan:
Catat Ulasan