Bismillahirahmanirahim..Ash hadu allah illa ha illallah wa ash hadu anna Muhammadar rasulullah..Haqqan Siddiqan.
Sabtu, 3 Oktober 2009
Pergerakan emas seterusnya (5-10-2009)
Hmm..maaf hampir sebulan saya tak menganalisa. Hmm biaselah macam macam hal dalam hidup ni..Busy memanjang..tambahan pulak bulan ibadah..memaksimakan ibadah dalam bulan mulia.
Oh ya..kepada follower blog ni saya ingin mengucapkan Selamat Hari Raya Maaf Zahir dan Batin. Segala kesalahan di pohon juga. Hmm..kami sekarang ni tengah dalam proses menstruktur balik kembali company Ezy Fine Gold yang tercinta..hehe..Nama Ezy Fine Gold ni merupakan satu nama yang begitu mempunyai sentimental value yang tidak ternilai harganya..Insya Allah..doakan kami ya..Mudah-mudahan Allah yang MAha pemurah lagi Maha Pemberi Rezeki meluaskan pintu-pintu rezeki kita semua..amin ya Razzak..
Oh ya..bagaimana pergerakan emas seterusnya? Hmm kita perhatikan analisa tersebut ya:
Gold ST: the upside prevails
Our pivot point stands at 975.
Our preference: As long as 975 is not broken down, we favour an upmove with 1033 and then 1070 as next targets.
Alternative scenario: Only the downside breakout of 975 will invalidate our bullish scenario. In this case, a decline should shape towards 930 at first, and then 850.
Comment: The break above 975 is a positive signal that has opened a path to 1033.
Trend: ST limited rise; MT bullish.
Supports and resistances:
1131 ***
1070 **
1033 ***
1004 last
975 **
930 **
850 ***
Rabu, 9 September 2009
Ahad, 6 September 2009
Pergerakan emas seterusnya (7-09-2009)
Our pivot point stands at 925.
Our preference: As long as 925 is not broken down, we favour an upmove with 1000 and then 1033 as next targets.
Alternative scenario: A break below 925 would not invalidate the medium-term bullish configuration, but the index could decline towards its next support at 870.
Comment: The daily technical indicators are bullish but are close to resistances.
Trend: ST rise; MT bullish.
Supports and resistances:
1120 ***
1033 **
1000 ***
990 last
925 **
870 **
800 ***
Sabtu, 22 Ogos 2009
Pergerakan Emas Seterusnya (23-08-2009)
Our pivot point stands at 910.
Our preference: As long as 910 is not broken down, we favour an upmove with 960 and then 973 as next targets.
Alternative scenario: A break below 910 would not invalidate the medium-term bullish configuration, but the index could decline towards its next support at 880.
Comment: Daily indicators are positive but lack momentum, we are cautious.
Trend: ST limited decline; MT bullish.
Supports and resistances:
1000 ***
973 **
960 ***
953 last
910 **
880 **
850 ***
Isnin, 17 Ogos 2009
Kemana Pergerakan Emas Seterusnya (17082009)
Pivot: 950.90
Our Preference: SHORT positions @ 948 with targets @ 940 & 935.
Alternative scenario: The upside penetration of 950.9 will call for a rebound towards 960.4 & 972.
Comment: the false breakout of 950.9 is a negative signal that has opened a path to 930.
Trend: ST Ltd downside; MT Bullish
Key levels Comment
972** Intraday resistance
960.4** Intraday resistance
950.9** Intraday pivot point
942 Last
940*** Intraday support
935** Intraday support
930*** Intraday support
Khamis, 13 Ogos 2009
Kemana Pergerakan Emas Seterusnya (14082009)
Our Preference: LONG positions @ 947 with targets @ 952.4 & 957.3.
Alternative scenario: The downside breakout of 944.5 will open the way to 940 & 932.5.
Comment: the immediate trend remains up and the momentum is strong.
Trend: ST Ltd upside; MT Bullish
Key levels Comment
962.5* Fib retracement (50%)
957.3*** Intraday resistance
952.4** Intraday resistance
951 Last
944.5*** Intraday pivot point
940** Intraday support
932.5*** Intraday support
Selasa, 11 Ogos 2009
Pergerakkan Emas seterusnya...(11082009)
Pivot: 948.80
Our Preference: LONG positions above 948.8 with 962.5 & 967.5 as next targets.
Alternative scenario: The downside penetration of 948.8 will call for a slide towards 943.4 & 940.
Comment: the 948.8 key support (50% retracement) is expected to favour a recovery.
Trend: ST Ltd upside; MT Bullish
Key levels Comment
972* Intraday resistance
967.5** Intraday resistance
962.5** Intraday resistance
956.05 Last
948.8*** Intraday pivot point
943.4** Fib retracement (61.8%)
940** Intraday support
Isnin, 27 Julai 2009
Jumaat, 17 Julai 2009
Kemana Pergerakan Emas Seterusnya (17072009)
DAILY GRAPH
Having stopped slightly below the strategic resistance level 998 (“Z” trend line), gold eventually formed up a “double top” trend-turning figure at H4 graph (denoted as “a-a+” trend) and executed it after getting under the level 967. Such an event is a very important signal for “B-B+” daily trend’s turn. I’m expecting its lower bound to be broken shortly and, if gold goes under the level 945 (under the “B” trend line), the uptrend will be changed to downtrend and gold will set the target of lowering to support level 903.
MONTHLY GRAPH
Isnin, 6 Julai 2009
Kemana Pergerakan Emas Seterusnya (07072009)
Ini merupakan graph pada time frame H4. Ketika graph ini di ambil, harga emas berada pada tahap 922.70 usd/oz. Harga emas ektika ini berada di dalam keadaan uptrend dimana puncak yang boleh dicapai oleh harga emas ini ialah pada 945.70 usd/oz.
Pada graph D1, kita dapat lihat bahawa , pergerakan emas akan mengalami sedikit sebnayak prosess turun naik sehingga puncak yang boleh di capai ketika analisis ini di buat adalah pada point 990usd/oz
Isnin, 22 Jun 2009
Kemana Pergerakan Emas Seterusnya (22062009)
Khamis, 18 Jun 2009
Kemana Pergerakan Emas Seterusnya (18062009)
H4 graph
Gold is being traded below level 944 (below the neckline of “head and shoulders” trend-turning figure), what speaks in favor of getting to target level 903 in nearest future (within the “a-a+” uptrend). Resistance is found at level 944 once again.
Daily Graph
Having stopped slightly below the strategic resistance level 998 (“Z” trend line), gold eventually formed up a “double top” trend-turning figure at H4 graph (denoted as “a-a+” trend) and executed it after getting under the level 967. Such an event is a very important signal for “B-B+” daily trend’s turn. I’m expecting its lower bound to be broken shortly and, if gold goes under the level 945 (under the “B” trend line), the uptrend will be changed to downtrend and gold will set the target of lowering to support level 903.
Monthly Graph
Isnin, 15 Jun 2009
Kemana Pergerakan Emas Seterusnya (15062009)
H4 Graph
Daily Graph
Monthly Graph
Selasa, 9 Jun 2009
Kemana Pergerakan Emas Seterusnya (09062009)
Daily Graph
Monthly Graph
Isnin, 8 Jun 2009
Khamis, 4 Jun 2009
Kemana Pergerakan Emas (04052009)
Daily Graph
Monthly Graph
Rabu, 3 Jun 2009
Ahad, 31 Mei 2009
Kemana Pergerakan Emas (01062009)
Jumaat, 29 Mei 2009
Kemana Pergerakan Emas 29052009
Malam tadi, Pergerakan emas berjaya melepasi 956 dan hanya mampu mencecah 965 USD/oz.
Oleh sebab tidak mempunyai kekuatan untuk melepasi 965 USD/oz, maka ianya akan bergerak ke arah selatan semula (downtrend for correction ) ke arah 960 USD/oz.
Perhatikahn point 951 USD/oz, sekiranya harga tidak dapat bergerak lebih rendah dari 951 USD/oz, maka ia akan melantun kembali ke 970>>980>>990 USD /oz !!
Ini kerana minggu ni dah merupakan akhir bulan, dan minggu depan awal bulan, dan selalunya, jika market uptrend, awal bulan akan lebih tinggi dari akhir bulan sebelumnya.
Wallahu alam..
Rabu, 27 Mei 2009
Kemana Pergerakan Emas (28052009)
Kat sini ada dua condition. Sekiranya emas tidak dapat melepasi 941usd/oz, ia akan menunjukkan uptrend mungkin ke 970.
tetapi sekiranya ianya dapat melepasi 941usd/oz, ia akan mencuba pula 935us/oz dimana 935usd/oz adalah titik support paling kuat, yang akan merubah trend secara keseluruhannya.
So perhatikan kedua2 kebarangkalian yang boleh berlaku..Dan sekiranya emas berada di atas paras 935usd/oz untuk beberapa hari ni, maka pembukaan awal june ia akan menunjukkan uptrend.
Projection fibo line menunjukkan emas bakal bergerak atau menyentuh 970 usd/oz.
Wallahualam
Selasa, 26 Mei 2009
What Is Gold Scrap?
- Scrap gold is valued by its karat weight--10K, 14K, 18K, 22K or 24K. The karat value relates to the percentage of gold in the piece. The higher number of karats, the greater the percentage of gold. Understand that 24K is 100 percent gold, 10K is 40 percent gold. You will often find a marking on the clasp of your necklace or bracelet, on the underside of your ring, or on the back of your earrings that will indicate what karat your jewelry is made from. Dental gold ranges in karat value from 10 to 22 karats.
- Gold with a higher karat value is also softer and less durable than gold that is not 100 percent pure. Gold is mixed with other alloys, such as copper, silver, nickel and zinc, to add strength, color variety and durability.
- The term scrap gold has gained in popularity recently due to the historic rise in the price of gold. In truth, there is nothing remotely scrap-like about gold. Gold in any form has value. Whether its broken, twisted, melted, scratched or worn, the beauty of gold is that it can be melted down and made into a brand new necklace, bar, coin or tooth.
- Selling scrap gold can be a lucrative way to make extra cash, given the current price of gold. Some of the scrap gold you own may include gemstones. If you plan to sell the gold, it is best to remove the stones first, especially if you are selling the gold online. The price of gold fluctuates daily, but there are dealers online, U.S. Gold Buyers among others, who list the price per pennyweight for the various karat values. Keep in mind that the dealers include a refining fee in their price, but shopping around is easy with a few mouse clicks. Selling your gold directly to a refiner or dealer is better than going through a middleman, like a jeweler or a pawn shop.
- Did you know your cell phone is made with gold? How about your computer? Many different kinds of electronics contain gold circuits, connectors and pins, so before you throw away that old phone, open it up and check out the metal parts. Anything gold plated is also considered scrap gold and has value to a dealer. Whether you are selling your gold or stockpiling for a rainy day, scrap gold is a treasure no matter where you find it.
Identification
Types
Effects
Considerations
Misconceptions
Isnin, 25 Mei 2009
Kemana Pergerakan Emas (26052009)
Ahad, 24 Mei 2009
Kemana arah pergerakan emas (25052009)
If this count is correct, we are not likely to see Price of Gold below 940 for several more weeks, possibly in late June at the earliest.
After catching up with my studies, I'm seeing the significant potential for Price of gold to top this current wave up early this week (Monday?) and then start it's slide into early June, with a low as extreme as 880, before another rally takes off. My concern is that if it comes to pass, it may signify a C of (B) wave up into late June/early July, with a Major wave (C) down to come there after into Aug-Nov. Ending somewhere between 640-750.
I see a USD bullish count that could make for a rally back up to 94.70 - 96.51, however for this to be accomplished, stocks AND PMs would have to sell off hard. A serious general tax-hike threat might do it, along with an excise tax on gold bullion purchases? I'll try to plot this count soon.
Rabu, 20 Mei 2009
Kemana Pergerakan Emas (21052009)
CLICK DI SINI UNTUK H4
Kemana Pergerakkan emas (20052009)
Selasa, 19 Mei 2009
Kemana arah pergerakan emas (19052009)
Okay,setelah kita perhatikan pergerakan emas pada hari ini, didapati emas tidak dapat melepasi point 935 USD/oz dan kemungkinan besar ianya akan bergerak ke arah 914-907USD/oz.
Sabtu, 16 Mei 2009
Gold: The Once and Future Money
Ahad, 3 Mei 2009
Gold Bearish Trend Continues.
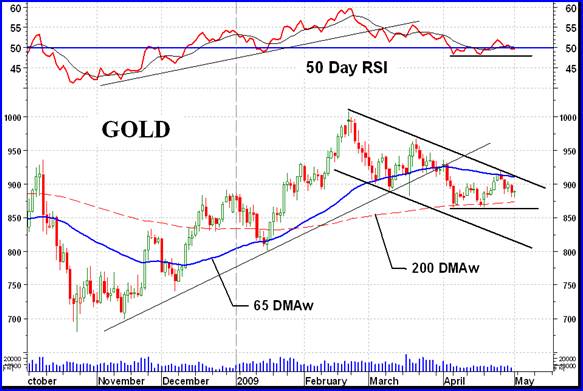
Since issuing a bear signal the long term point and figure (P&F) chart has set up a support at the $870 level. $855 would be a new bear low for this latest trend. However, the chart has also set up a pattern that could cause the P&F to reverse itself and go back into a long term bull mode. At this time that would require a move to the $930 level and give us an initial projection to $1050. For now we’ll just have to wait and see which way the wind is blowing and which direction the price will take. For now the bear projection remains to the $705 level.
As for what the normal indicators are telling us, well they are not yet bearish as is the P&F chart. The gold price remains above its positive sloping (weighted) moving average line although it is heading towards the line. The momentum indicator remains just above its neutral line in the positive zone but just below its negative trigger line. The volume indicator is showing more weakness and remains below its negative sloping trigger line. As far as the normal trend and strength indicators are concerned the long term rating remains BULLISH for now.
The gold price continues to show weakness and especially when combined with the very low volume activity. Although a clear support is shown in the price (and momentum) one starts to wonder about its viability. Questions, questions!
Going through the routine we see that the recent price action continued below the intermediate term moving average line and the line slope continues downward. The momentum indicator is playing around with its neutral line and closed the week just below the line in its negative zone. It is also just a shade below its negative trigger line. For now the action remains inside that intermediate term down trending channel. What can I say but that the intermediate term rating is BEARISH, at this time. With the price action trapped between both moving average lines one has to give.
SHORT TERM
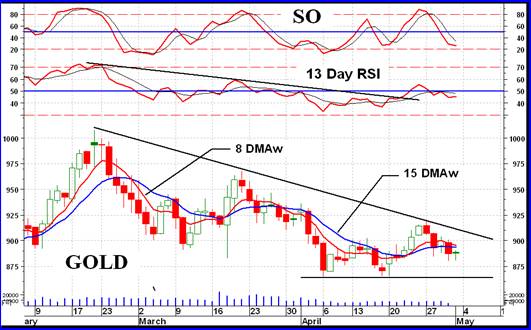
Short term it looks like we are going through a little period of negative trend. It might still go a little lower but here’s hoping it stops above the support. With the price below its negative moving average line and the momentum indicator in its negative zone about the only non-confirmation we have of a negative trend is the very short term moving average line. It has not yet crossed the short term line on the down side but is closing the gap fast. The short term must be thought of as BEARISH at this time.
As for the direction of least resistance, that would be to the down side although there is some indication during Friday’s action that it might turn around.
Selasa, 28 April 2009
Bagaimana wang dicipta ?
1. Wang diwujudkan melalui pinjaman dan membelanjakannya.Fractional Reserve Banking. (Money is literally borrowed and spent into existence.)
2. Wang dicetak atas kertas kosong tanpa sandaran apa - apa oleh Federal Reserve.
Federal Reserve memiliki kuasa :
a) Menentukan kadar faedah.
b) Membeli aset – aset seperti hutang kerajaan (government debt) dengan wang kertas baru yang dicetak.
Apabila kadar faedah berada dalam tahap yang sangat rendah , ia akan mengalakkan korporat dan individu berbelanja.
Majoriti wang yang diwujudkan datang dari pinjaman dan perbelanjaan sektor swasta dan individu.
Wang tunai ( cash flow) 5 % , Wang elektronik ( cek, akaun dll ) 95 %.
Federal Reserve boleh mencipta wang baru hanya dengan menekan nombor pada keyboard komputer dan membeli apa sahaja aset yang mereka perlukan. Mereka boleh mencipta berapa pun jumlah wang yang diperlukan untuk menjalankan ekonomi bagi menyelesaikan hutang lama dan baru. Mereka akan mencetak wang baru kerana bagi mereka inflasi esok hari adalah lebih baik dari keruntuhan terus sistem ekonomi sekarang.
Perbendaharaan US (U.S. Treasury) berbelanja dengan US $450 Billion defisit ( belanja lebih dari aset ). Bank Pusat hanya mencetak wang itu. Secara global bank bank pusat mencetak wang baru berjumlah $800 Billion. Sebab itu Federal Reserve Governor, Ben S. Bernanke, suka menamakannya dengan wang helikopter "Helicopter Money".
40 % dari hutang perbedaharaan US (U.S. Treasury debt) dipegang oleh orang luar. Bank bank Pusat Asia memegang lebih dari US$ 1 Trillion aset US.
Apabila lebih banyak wang yang dicipta ini mengejar barangan yang sama, tidak dapat tidak mestilah berlaku inflasi.
Jumlah defisit yang besar memberi jalan kepada Bank Pusat luar mencetak wang mereka. Syarikat luar mendapatkan dollar melalui ekspot barangan mereka ke US. Bank Pusat luar mengeluarkan mata wang mereka untuk ditukarkan dengan dollar, dan dengan dollar tersebut mereka membeli hutang Perbendaharaan US (U.S. treasury debt). Mudah sahaja, wang baru pulak dicipta di negara tersebut.
Contohnya China, Bank Pusat China mencetak wang baru untuk membeli dollar. Dollar didapati dari ekspot China ke US, dollar datang dari US Treasury. Ini menyebabkan berlakunya inflasi 5% setahun di China.
Apabila US berbelanja defisit , dollar baru akan tercipta. Setiap kali dollar baru bertukar tangan ke Negara asing. Bank Pusat Negara tersebut pulak mencipta wang baru untuk ditukar dengan dollar.
Semua Negara bergantung kepada perbelajaan US.
Apabila rakyak US tidak berbelanja, seluruh dunia tidak bergerak.
Begitu besarnya pergantungan seluruh dunia kepada Amerika Syarikat !
• Sumber:www.dirham2dinar.com
Selasa, 21 April 2009
Gold Market Update
Returning to consideration of the gold chart we can see that last week's fall has not as yet resulted in it breaking below its early April low or below the 200-day moving average or below the support level shown. This confluence of supporting factors means that this is a very important zone, so if gold breaks below it, it could plunge way below the support of the downtrend channel shown. Traders may therefore want to set stops accordingly.
Ahad, 19 April 2009
Keahlian Koperasi Ushawan Emas Malaysia Berhad dibuka kepada orang ramai.
Sila buat pengesahan kehadiran anda kepada En Rizmeer 012-2776294 bagi memudahkan urusan persiapan dan melancarkan lagi perjalanan majlis.